In an article a few months ago in this magazine, I tried to explain one of the reasons why the protests in Tirana finally began, after so many years of poor governance and corruption. One of the main reasons is the ambiguity of property law and the lack of ownership after 36 years of democracy. This is a colossal failure of the rule of law, and, while the law on strategic investment usurps the right of residents who have lived on their land for decades, the conflict between the state and the citizen grows. However, this reason, in isolation, cannot explain the political fatigue and the massive anger seen in the protests. Although the property issue is very important for an overwhelming number of citizens, protests of this type usually start when economic conditions worsen enough for a sufficient proportion of society. Although the expression of dissatisfaction is political, the fundamental reasons are economic. In Albania’s case, the price level has made the country unaffordable for the average citizen. This is something that is felt in daily life, but a statistical comparison with countries in the region and beyond would be useful to see how expensive Albania really is.
Let’s start with a simple comparison from Eurostat. Two columns: the first is the overall price level as a percentage of the EU-27 average; the second is nominal GDP per capita as a percentage of the EU-27 average. Albania’s overall price level is 72.6% of the EU average, while its nominal GDP per capita is 27.7%. Albanian real incomes are really low compared to price levels.
| Price level and nominal GDP per capita | ||
| 2025; EU-27 = 100 | ||
| Country | Price level | Nominal GDP per capita (EU-27 = 100) |
|---|---|---|
| Bosnia and Herzegovina | 59.2 | 20.4 |
| Albania | 72.6 | 27.7 |
| North Macedonia | 54.8 | 22.3 |
| Montenegro | 66.1 | 31.5 |
| Serbia | 68.0 | 32.5 |
| Bulgaria | 62.5 | 43.4 |
| Hungary | 77.5 | 55.2 |
| Croatia | 78.4 | 57.5 |
| Romania | 65.1 | 47.9 |
| Poland | 73.3 | 59.3 |
| GDP per capita is nominal, in euros, expressed as a share of the EU-27 average. PLIs are comparative indicators and are not intended for strict country rankings. For sources see note at the bottom. | ||
Let’s focus a bit more on food prices, because those are the prices that hurt the most because they are confronted daily. The following table is similar: what are our prices as a percentage of European food prices, what percentage of European income do we have, and the ratio. With regards to food prices, Albania is even more unaffordable, with 103% of European prices and 28% of income.
One of the reasons (not the main one) that food is very expensive in Albania is that it is taxed at 20%. Except for Bulgaria, other countries tax it much less.
| Food prices | ||
| Food price index and VAT on food, 2025 | ||
| Country | Food price index (EU-27 = 100) | VAT on food |
|---|---|---|
| Bosnia and Herzegovina | 85.8 | 17% |
| Albania | 103.8 | 20% |
| North Macedonia | 74.8 | 5% |
| Serbia | 97.1 | 10% |
| Montenegro | 86.5 | 7% |
| Bulgaria | 92.6 | 20% |
| Croatia | 105.5 | 5% / 13% |
| Hungary | 95.2 | 5% / 18% / 27% |
| Romania | 79.8 | 9% → 11% (from 1 Aug 2025) |
| Poland | 89.5 | 5% (most) |
| Food VAT varies by product; the column reports the main rate or range, not a weighted average for the Eurostat basket. For sources see note at the bottom. | ||
This is a highly regressive policy, because Albania has the highest food-spending share of total consumption spending among the countries compared. It is also what poor people spend most on.
| How large is food’s share of household spending? | |
| Food and non-alcoholic beverages as a share of household final consumption, 2025 | |
| Country | Share spent on food |
|---|---|
| Albania | 31.8% |
| Bosnia and Herzegovina | 31.3% |
| North Macedonia | 31.1% |
| Montenegro | 28.1% |
| Serbia | 23.4% |
| Romania | 22.7% |
| Croatia | 22.3% |
| Bulgaria | 20.9% |
| Poland | 18.2% |
| Hungary | 17.4% |
| Calculation: nominal expenditure on food and non-alcoholic beverages / nominal household final consumption. For sources see note at the bottom. | |
One major complication in these comparisons is that the euro has fallen sharply against the Albanian lek. When Albanian prices are converted into euros, a stronger lek makes them appear higher relative to other countries, even if prices in lek have not risen by the same amount. Part of Albania’s high euro-based price level may therefore reflect the exchange rate, rather than domestic prices alone.
The following table avoids precisely this problem. It adjusts wages for the purchasing power of food: wages and food prices are first measured in local currency, so the exchange rate cancels out. In other words, it does not ask how many euros an Albanian wage is worth; it asks how much food that wage can buy compared with wages elsewhere. On this measure too, Albania ranks last in our comparison. The average Albanian wage buys less than any other country in the list, including Balkan countries.
| How much food can the average wage buy? | |||
| Average monthly gross wage adjusted for food PPP, 2025 | |||
| Country | Monthly gross wage (€) | Food price index (EU-27 = 100) | Food-adjusted wage (PPS) |
|---|---|---|---|
| Poland | 2,100 | 89.5 | 2,346 |
| Romania | 1,806 | 79.8 | 2,264 |
| Croatia | 2,016 | 105.5 | 1,911 |
| Hungary | 1,772 | 95.2 | 1,862 |
| North Macedonia | 1,102 | 74.8 | 1,473 |
| Bosnia and Herzegovina | 1,246 | 85.8 | 1,452 |
| Bulgaria | 1,331 | 92.6 | 1,437 |
| Montenegro | 1,206 | 86.5 | 1,394 |
| Serbia | 1,289 | 97.1 | 1,328 |
| Albania | 857 | 103.8 | 826 |
| Formula: monthly gross wage in local currency / food PPP. This is equivalent to wage in euros × 100 / food-price index, so the market exchange rate cancels out. Adjusted values are calculated from unrounded inputs. For sources see note at the bottom. | |||
The real wage (wage divided by the general price level) in Albania is the lowest in the list.
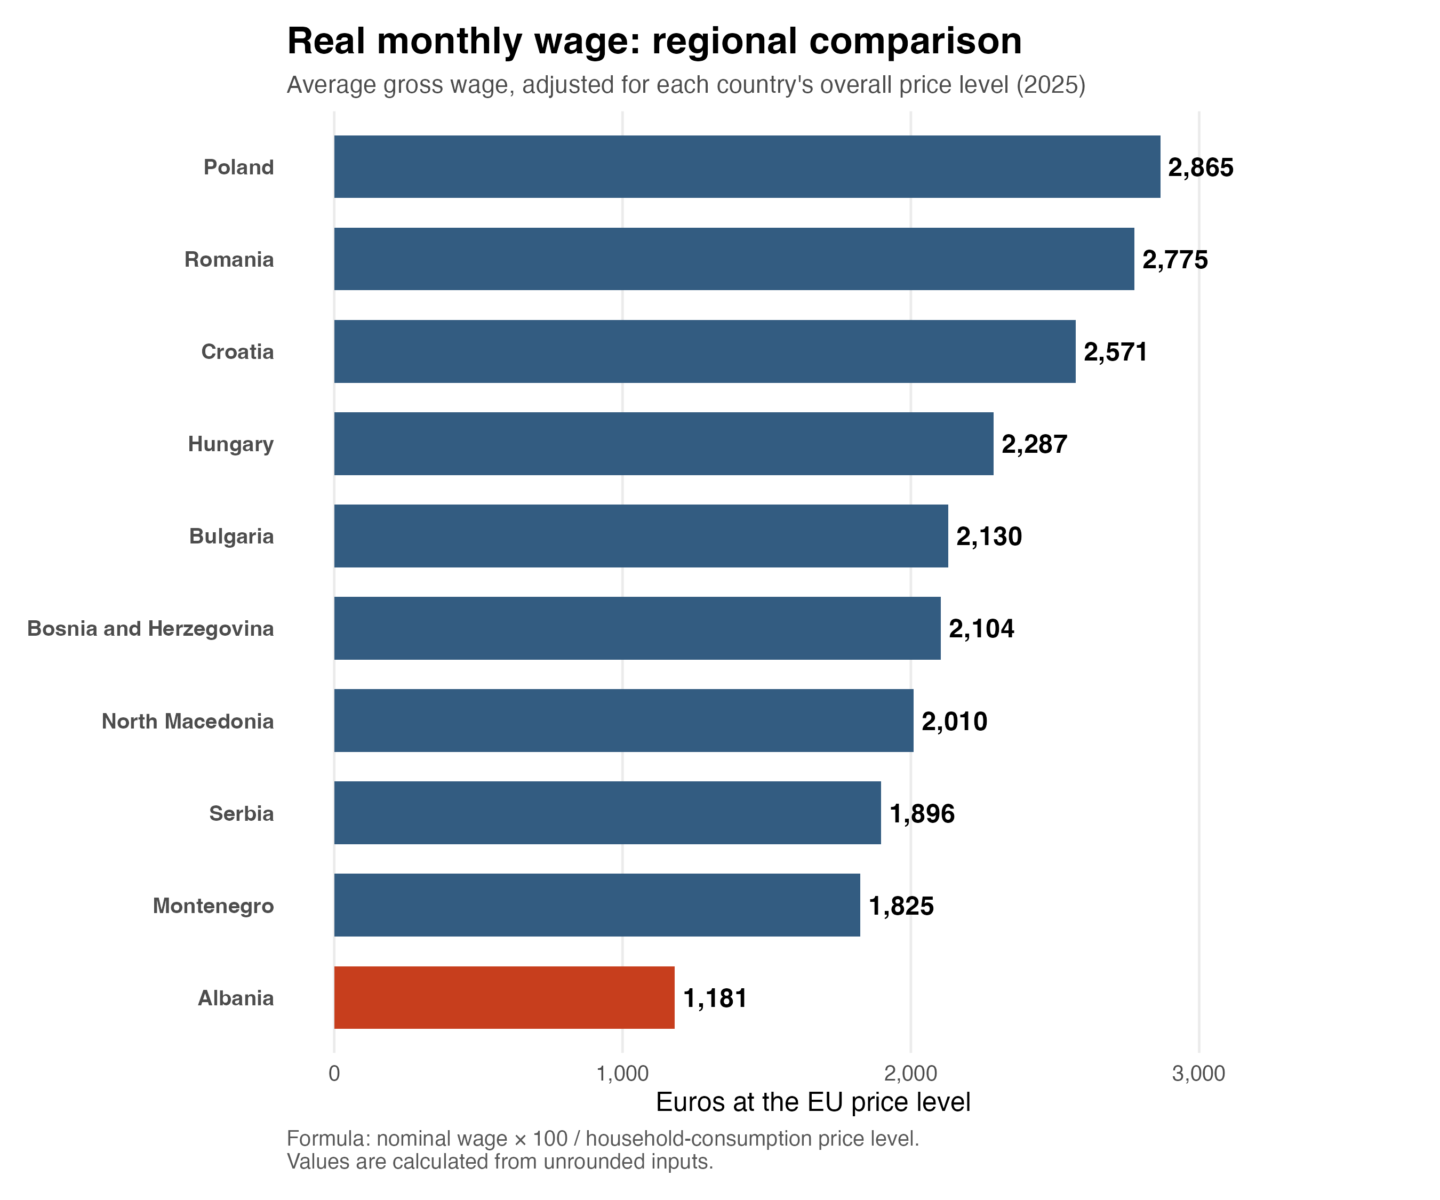
What about housing? Here, Albania continues to be the least affordable in the list. In the housing graph, the exchange-rate effect works in the opposite direction. Apartment prices are quoted in euros; a stronger lek raises the euro value of an Albanian wage and therefore reduces the number of annual salaries needed to buy an apartment. The current exchange rate thus makes housing appear more affordable, not less. Albania’s poor result in this graph cannot be explained by the weaker euro; if anything, the exchange rate moderates it.
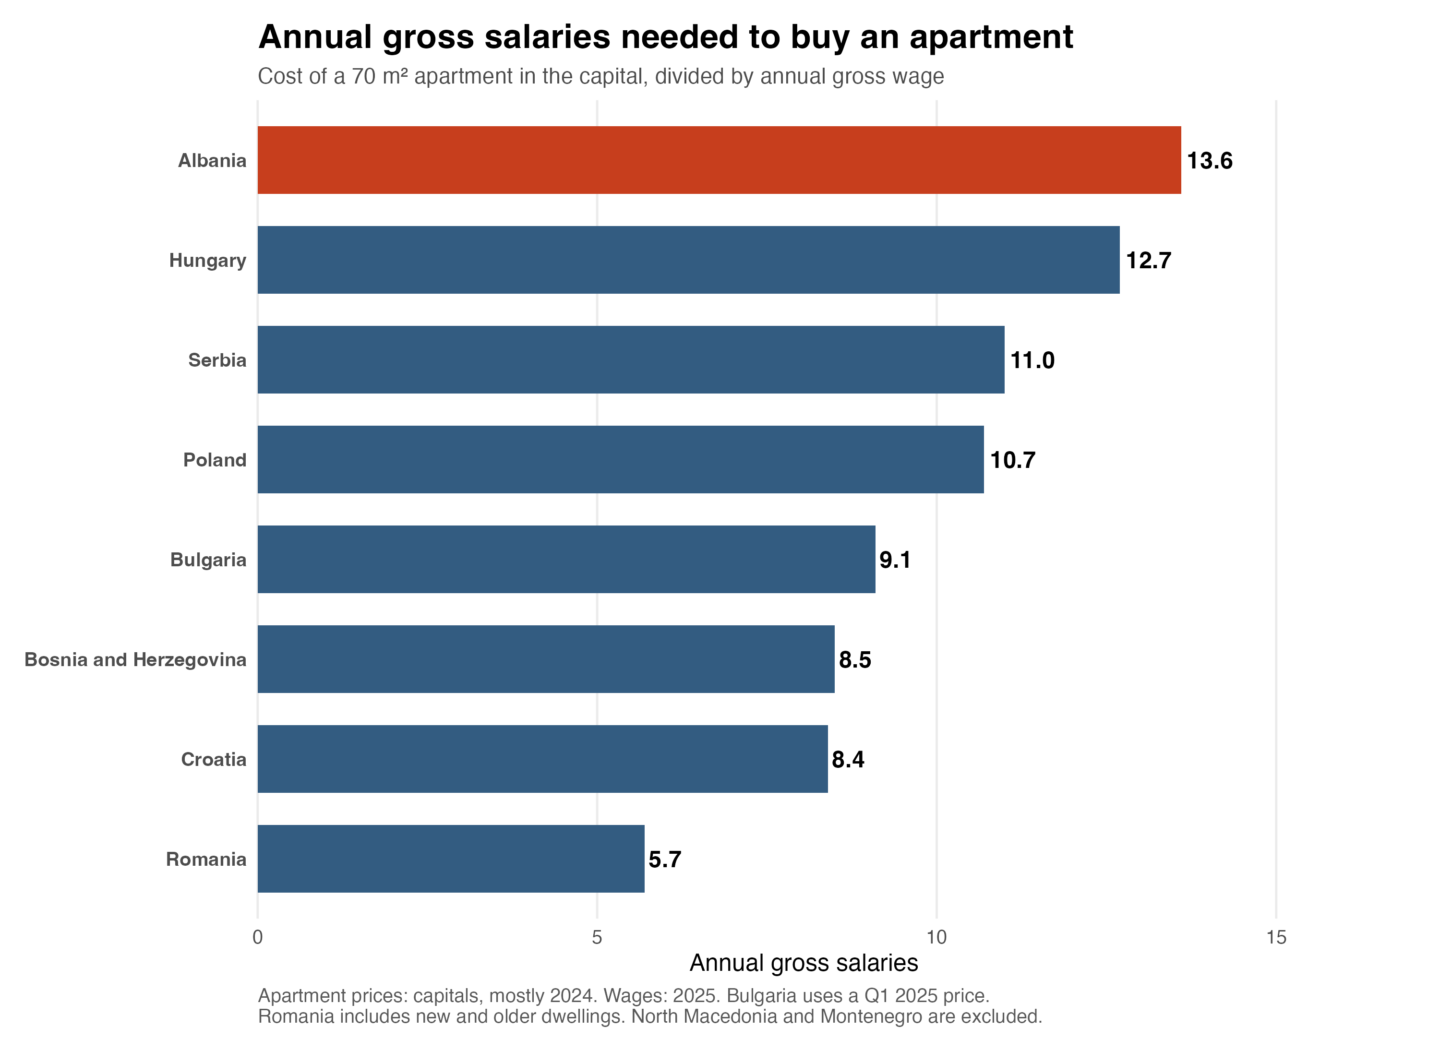
In summary, Albania is completely unaffordable for the average citizen. Most people who rise up in protest do so because they have been pushed to the edge; they have nowhere else to turn. Their children leave because they cannot afford to live with the wage on offer, and they themselves live meagerly with pensions that barely suffice. These last 5 years have made Albania a place that is affordable only to those who have European incomes; for the rest, Albania has German prices with Albanian wages.
(c) 2026 Elton Dusha. All rights belong to the author. The cover image has been generated by AI. This is the English version of “Çmimet, plako, çmimet”.
Note: sources for the data in the tables above can be accessed through the links below:
Click to access sources_food_vat_2025.pdf
Click to access sources_wages_2025.pdf
Discover more from Peizazhe të fjalës
Subscribe to get the latest posts sent to your email.